
“When stock can be bought below a business’s value, it is probably the best use of cash.”
Every year, a new strategy appears, claiming to be the secret to stock market success. Some are profitable for a time, even spectacularly so. However, trends eventually lose their momentum, reality intervenes, and yesterday’s win leads to failure tomorrow. Cycles of booms, bubbles, and busts repeat in all markets, from Dutch tulips and Florida real estate to dot.com companies and collateralized mortgage obligations (CMOs).
The most successful long-term investors avoid the temptations of fads, esoteric formulae, and schemes, preferring the simple for the sizzle. They rely on common sense to make investment decisions rather than following the crowd. Warren Buffett started investing in 1956 with $100, became a millionaire in 1962, and a billionaire in 1985. In 2020, he was acknowledged as the world’s sixth-wealthiest person with a net worth of $81 billion (after giving $37 billion to charity the previous fourteen years. For his success, he earned the sobriquet, “Oracle of Omaha.
Buffett’s investment philosophy is surprisingly simple and based on a few basic tenets:
- The best returns are achieved by companies producing the same product or service for several years.
- A company must produce a product or service that is (1) needed or desired, (2) has no close substitute, and (2) is not regulated. Buffett believes these characteristics enable a company to maintain or increase prices without losing market share or unit volume.
- Companies without the ability to reinvest excess cash at above-average rates should return that money in dividends or share buy-backs to the shareholders.
- Every dollar of retained earnings should create at least one dollar of market value (The One Dollar Premise).
- Buy the stocks of companies that earn above-average returns at prices far below their intrinsic value.
Calculation of the One Dollar Premise
Anyone with access to historical results and the time to spend in the exercise can make a quick calculation of the return on retained earnings:
MVi = (MCe – MCb)/(REe – REb)
MVi = market value increase (decrease) per $1 retained earnings
MCe = market cap at the end of the period
MCb = market cap at the beginning of the period
REe = retained earnings at the end of the period
REb = retained earnings at the beginning of the period
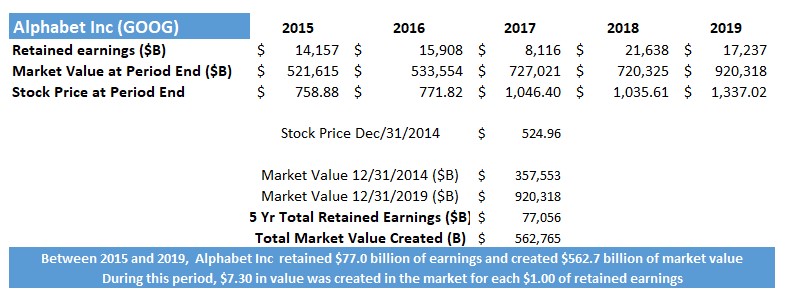
- Subtract the retained earnings balance from 3, 5, or 10 years past. For example, Alphabet (Google) had retained earnings in 2014 of $75.06 billion and $152.12 billion in 2019. In the 5-year, the company kept $77.06 billion of profits in the company.
- Compare the market value today with the market corresponding to the beginning year of the retained earnings above. Alphabet’s market cap was $357.55 billion at the beginning of 2015, with $920.32 billion in 2019. Market value increased $562.76 billion during the five years.
- Compare the increase in market value with the increase in retained earnings. In this case, Google produced $7.30 in increased market value for each $1.00 in retained earnings.
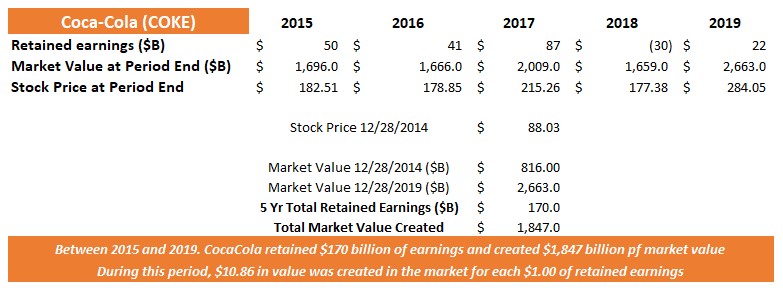
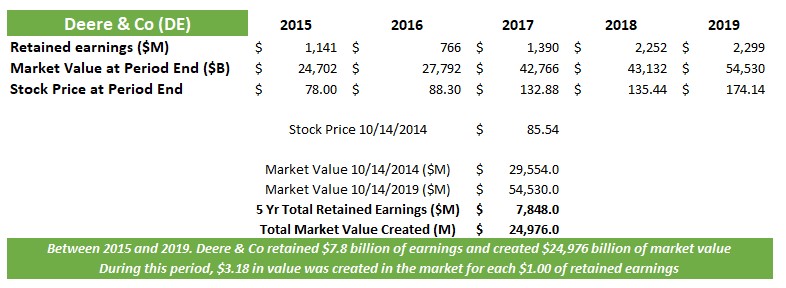
While knowing that Google does make excellent use of its retained earnings, a comparison with other companies – in and outside its industry – is a more reliable indicator of management’s prowess. A similar calculation for Coca Cola and Deere & Co provides additional insight:
A comparison of different periods highlights the difference in management’s ability to create value in various industries:
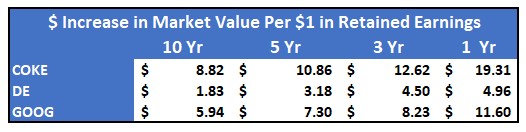
While the above figures suggest that all three companies are adept at reinvesting their retained earnings, Coca-Cola would seem to be the best investment. However, when looking at the compound average increase in stock value of the last five years, COKE provided its owners with the least market appreciation with a CAGR of 9.25%. Looking at stock appreciation alone, Deere would appear to be the best buy based on their average of 17.43% over the five-years. In comparison, Google was second at 11.9% during the same period.
The Importance of Intrinsic Value of a Company
The objective of fundamental analysis is to determine the intrinsic value of a company. A ratio of the intrinsic value with the market price is an indicator to buy or sell. Buffett recommends buying a company only when its intrinsic value is higher than its market price. While Buffett’s One Dollar Premise is one indicator of value, relying on a single indicator is not recommended.
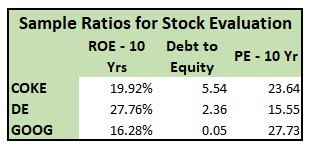
The table above compares three ratios for Coca-Cola, Deere & Co, and Alphabet (Google). Deere & Co produced the highest 10-year return on equity (ROE) but has the lowest price/earnings multiple (PE), a sign that investors believe the company’s future earning potential is less than Coca-Cola or Google. Coca Cola produced a higher 10-year ROE than Google but has a lower PE. Since each company’s use of leverage is different, investors need to understand how debt affects future earnings.
Fundamental investors rely on hundreds of financial statement calculations to identify candidates for purchase, akin to looking for the “needle in the haystack” since there are more than 6,000 publicly traded companies. The process is arduous because market prices continuously change, and each price change can affect the result.
Final Thoughts
Professional investors rely on massive databases and sophisticated computers to perform the heavy lifting of data collection and analysis. Many supplement their experience with complex logarithms to make comparisons and suggestions. Fortunately, non-professionals today have access to many of the same tools used in the big investment houses.
An investment adviser like wealthX, using Artificial Intelligence (AI), continuously updates and recalculates hundreds of financial ratios and relationships – including Buffett’s One Dollar Premise – to make investment recommendations to their clients. A low monthly membership fee allows investors to benefit from the same strategies employed by the Oracle of Omaha.